
Week In Review: The Delta Days of Summer, 23 July 2021
Week In Review: The Delta Days of Summer
US equity indexes were higher on the week: DJIA 1.1%, S&P 500 2.0%, NASDAQ 2.8%. After falling heavily on Monday, all three equity indexes recovered during the week, reaching all time highs on Friday. The DJIA surpassed 35,000 for the first time on Friday.
The Exante Data Team took a closer look at equity flows: “Globally, flows to US equity funds has reached $300bn so far this year, a huge departure from trends since at least 2015. Global Flows have also surged to over $500bn, outstripping the strong flows seen in 2017. However, both dynamics seem to be abating with the dark blue lines in the charts below beginning to flatten. US and global equity funds are seeing around $40bn and $60bn in inflows per month, respectively. This is about half the pace seen in February and March. Moreover, the trend through the first half of July does appear to put the month on track to underperform prior months. Given the prolonged uptrend in global equity markets, it is important to watch if global flow trends do moderate.”
Chart: Cumulative Flows to US-focused Equity Funds

Chart: Cumulative Flows to Global Equity Funds

USD Comment
USD strengthened on the week, which was notable given that US equity indexes finished the week higher. The DXY ranged 93.17-92.51. EURUSD ranged 1.1754-1.1827. No dovish surprises from the ECB lifted EURUSD briefly on Thursday, but then the single currency retraced the gain. USDJPY ranged 109.10-110.53, with the low coming on Monday with the US equity selloff and as the US 10 year yield fell. AUD remained on its backfoot vs USD due to the spread of the Delta variant in Australia and the lockdowns to combat it.
Chart: FX betas to SPX moves post Monday sell-off to the week’s end. As the S&P recovered, our betas chart seems to show particularly strong recoveries in NOK (vs EUR), NZD and GBP. Notably, TRY, COP, KRW and ZAR failed to see much recovery.

Covid-19: Case Update
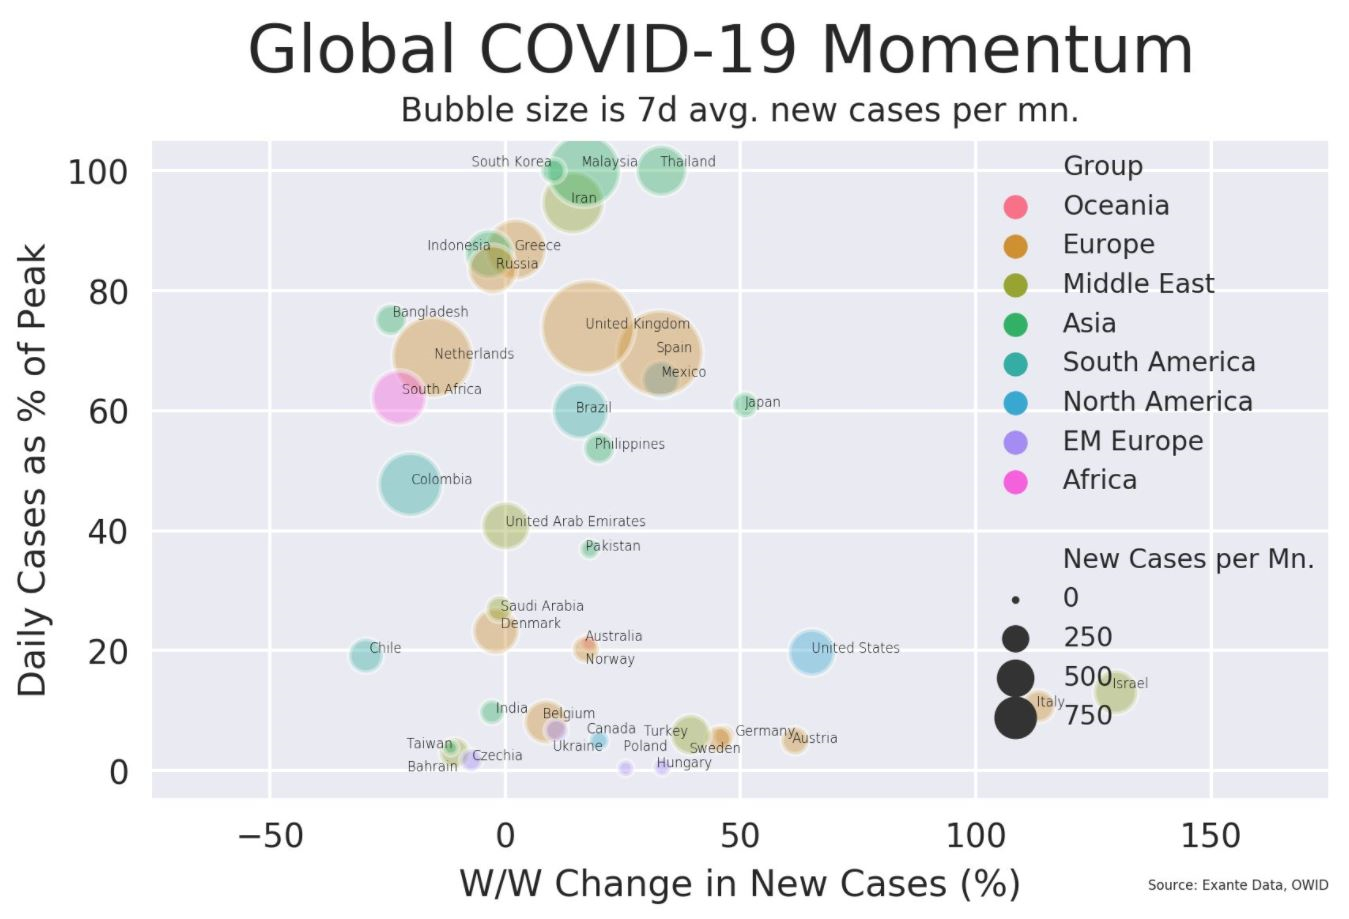
Work by Strategist Martin Rasmussen shows that cases remain high in a number of EM Asia and European countries, though case growth has moderated this week in most of those countries that have the highest case numbers. The chart below provides a snapshot of global case momentum, and we classify countries into three categories:
High (>20%) case growth and high case levels (>50% of prior peaks) are seen in Thailand, the UK, Spain, Mexico, and Japan.
High (>20%) case growth but moderate/low case levels (<50% of prior peaks) are seen in Israel, Italy, US, Austria, Australia, Germany, Sweden, Turkey, Hungary, and Poland.
Negative/low (<20%) case growth but high case levels (>50% of prior peaks) are seen in South Korea, Malaysia, Iran, Philippines, Indonesia, Indonesia, Greece, Russia, Netherlands, Bangladesh and South Africa.
Chart: International Covid-19 Momentum
Turning to the US, the chart below provides a snapshot of case momentum in the US by state. Maine, California, Arizona, and North Dakota have the worst momentum – ie high case growth, but have low case levels < 20% of their prior peaks. Louisiana and Hawaii are the states closest to their prior peaks at around 60% and have case growth >50%. Missouri has case growth >50% and case levels at >40% of its prior peak. For a snapshot of cases nationally – see this chart.
Regarding vaccinations in the US, Senior Strategist Alex Etra points out the following: The US has administered a large number of doses on aggregate, but two factors mean that the US could be more vulnerable than other countries with similar aggregate vaccination levels:
The share of people aged 50-65 who have been fully vaccinated is just 66%, much lower than the 86% in the UK.
Vaccination is highly uneven across states. Across all people (including children), around 70% has received at least one dose in Vermont, Massachusetts and Connecticut, though that number is only around 40% in Mississippi, Louisiana and Idaho. In the largest states, the number is 63% in California, 50% in Texas, 62% in New York and 56% in Florida. The state GDP-weighted national average vaccination rate is 57%.
Chart: Covid-19 Momentum by US State

Exante Data Happenings & Media
Follow us on Twitter for daily chart updates.
Bloomberg users – you can view Exante Data tweets on the terminal. Users can type into the blue command line: TWEETS BY EXANTE <GO>. Alternatively, to add to Launchpad: 1. Run SOCI <GO> 2. Type into the orange box Exante 3. Select the handle at the bottom “TWT_EXANTEDATA” 4. Click the white LLP <GO> to Open in Launchpad to view in Launchpad mode 5. To save the search >>> Click Actions in the top red tool bar >> Save Search
For clients, we have re-introduced the Covid-19 daily publication due to increasing interest and questions about the spread of the Delta variant. Each day, we will look at global case and vaccination trends, and will add thematic commentary sometimes.
How to reach us:
- Our Substack is public – Join us in discussing and debating macroeconomic topics – Subscribe here.
- If you are an institution and would like more information on our Macro Strategy, Global Flow Analytics, Exante Data API services, Digital Currency Series, and/or our Covid-19 vaccine rollout tracking and Tourism Recovery tracking — please reach out to us here.