
Week In Review: May Day. 12 March 2021
Week In Review: May Day
US equity indexes were stronger on the week: DJIA +4.1%, S&P 500 +2.6%, +3.1% NASDAQ. Positive news boosted the outlook for the economy and risk seeking sentiment. On Wednesday core CPI for February came in at +0.1% m/m – slightly below expectations. On Thursday, President Biden signed the USD1.9 trillion fiscal stimulus package and said that every adult in the US would be eligible for a vaccine by May 1. US Treasury yields rose on Friday, weighing on tech-heavy NASDAQ on the day. However, DJIA hit another record high on Friday.
Senior Advisor Chris Marsh notes, “With the USD1.9 trillion Biden Plan passing last week, the Federal deficit in the US could this (calendar) year reach USD3.2 trillion, broadly the same as in 2020 despite vaccine progress and the easing of lockdowns. With much of the plan front-loaded, assuming T-bill and deposit drawdown from February, net note and bond issuance during 2021Q2-Q3 could reach USD2 trillion—by far the largest net issuance in history—while bank reserves at the Fed reach record highs.”

Turning to Europe, here is Chris’ take on the ECB decision and press conference: “The ECB surprised positively last week when the Governing Council committed to increase the pace of asset purchases over the next quarter to offset any undue pressure on financing conditions. The press conference, however, raised a number of concerns about the future implementation of the PEPP. First, it was revealed that, despite recent market turmoil, the Executive Board preferred to wait for revised staff forecasts and policy meeting to accelerate purchases—potentially constraining policy during future market stress. Second, it now creates “taper” risk as each quarterly projection update is accompanied by an assessment of inflation and financing conditions and revised PEPP envelope.”
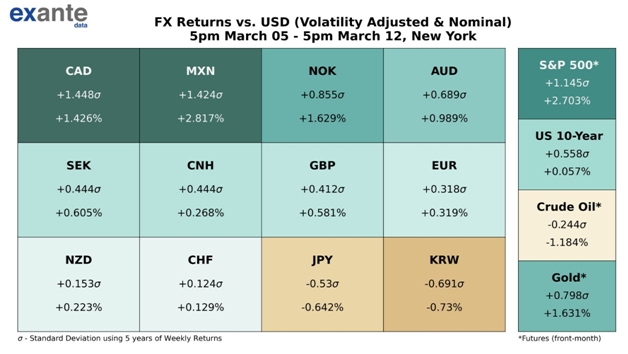
USD Comment
The USD was weaker on the week. The USD move was more consistent with the signal from risk assets this week. Risk-seeking sentiment came to the fore, especially on Thursday when President Biden signed the USD 1.9 trillion Covid relief bill. The DXY Index raged 92.50-91.37, with the low coming on Thursday. EUR/USD ranged 1.1853-1.1988. GBP/USD ranged 1.3801-1.4001. Higher beta currencies were supported vs. USD with the rise in US equities. AUD/USD reached a high of 0.7798 on Friday. Anti-growth currency JPY remained on its back foot vs. USD. USD/JPY broke 109.00 resistance – the high was 109.20. NOK continues to perform well on risk-on days both vs. USD and EUR.
Coronavirus Update
Europe: On a positive note, the European Commission granted conditional marketing authorization (CMA) for the COVID‑19 vaccine by Johnson and Johnson on Thursday. There are now four vaccines available in the EU. The J&J vaccine is supposed to start to arrive to the EU in April.
On a negative note, Denmark, Norway, and Iceland temporarily suspended the AstraZeneca vaccine on reports that blood clots had formed in some who had received the shot. However, later in the week, BBC News reported that the EU Medicines Agency (EMA) said, “There is currently no indication that vaccination has caused these conditions, which are not listed as side effects with this vaccine.” This week, Reuters reported that AstraZeneca cut its supply forecast of its vaccine to the EU. However, in mid-February PfizerBioNTech announced that it would supply an additional 200 million doses of its Covid-19 vaccine.
Taken together, at Exante Data we estimate that while Q1 EU vaccine supply will be lower than previously thought, Q2 EU vaccine supply will be much higher. In addition, our proprietary Exante Data model shows that the EU will reach herd immunity by late June – a few weeks to a month behind the US. The key for the EU remains stepping up the pace of administration along with increased supply.
A “May Day” celebration for the US: Speaking to the nation Thursday evening, US President Biden announced that he will direct US states to make all adults eligible for a Covid-19 vaccine by May 1. Biden also set a goal for some “semblance of normalcy” by the Fourth of July holiday. As of March 12 morning, 101.1 million doses of Covid-19 vaccines had been administered in the US.
Chart: EU and US – Daily New Vaccine Doses Administered

Exante Data Happenings & Media
We launched a Mexico Country Page on our data and analytics platform. Country Pages take a look at the most important idiosyncratic data points and charts for the individual country.
Other recent additions to our data and analytic platform include: The FX Range Projection Tool. It examines seasonal variation in FX performance and volatility. Users can see the historical average performance and volatility for most EM and G10 crosses by month and year and compare this to current/recent FX performance. The goal of this tool is to assist in picking entry and exit points for trades, based on the size of moves realized historically.
How to Reach Us:
- If you are an institution and would like more information on our Macro Strategy, our new FX Range Projection Tool, Global Flow Analytics, Exante Data API services, our Digital Currency Series, and/or our Covid research — please reach out to us here.
- Our Substack is public – Join us in discussing and debating large, macroeconomic topics – Subscribe here.