
Week In Review: August 7, 2020
US equity indexes were higher on the week: DJIA +3.8%, S&P 500 and NASDAQ were both up +2.5%.
Friday summed up the themes impacting the market this week when rising US-China tensions and continued uncertainty about the new US coronavirus stimulus package outweighed optimism from the decent July US jobs gain. July payrolls rose 1.76 million and the unemployment rate came in at 10.2% – both slightly better than expected. The knee-jerk reaction to the results was a weaker USD, but that reversed on the day. The Trump Administration gave an executive order that would effectively ban TikTok and WeChat in the US. The deadline is in 45 days, but few details of the executive order were given. WeChat is owned by Tencent and it is unclear whether the ban could extend to video games owned by Tencent. TikTok and owner ByteDance are in talks with Microsoft about a sale. In addition, the US imposed sanctions on Hong Kong leader Carrie Lam and ten other senior Chinese and Hong Kong officials.
This week, President Trump announced that he will reimpose a 10% tariff on “non-alloyed unwrought aluminum” imports from Canada starting August 16. Canada’s Deputy PM Freeland announced that Canada would retaliate fully and that the government intends to impose CAD 3.6 billion in counter-measures after a 30 day consultation period in which Canada will decide on its product list.
On the coronavirus front, US cases are plateauing and focus has shifted to a global second wave. Overall, markets have become much more resilient to spikes in case growth. We think self-policing will ensure that sustained explosive growth can be avoided, and also avoiding severe 2nd round-lock downs.
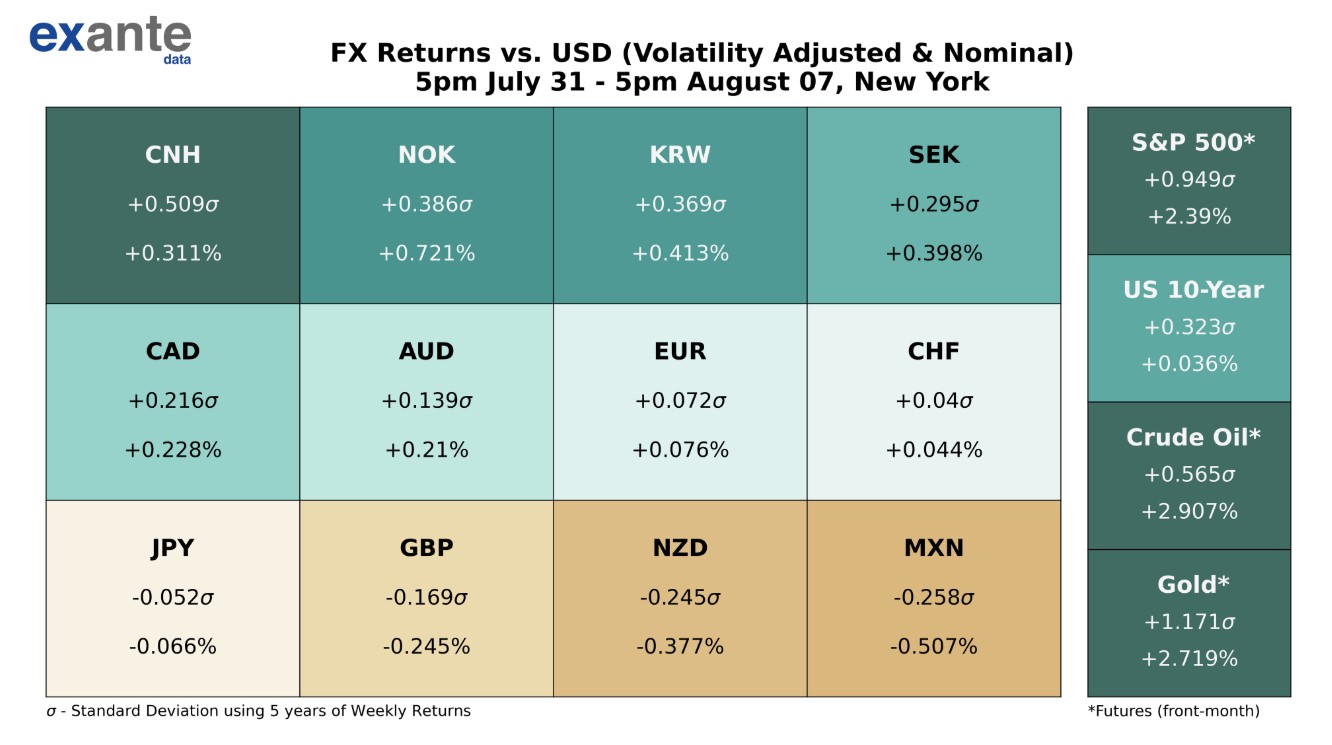
USD was broadly weaker (see heatmap below). NOK appreciated the most and SEK appreciated as well – two higher beta currencies that were helped by the rise in US equity indexes this week. Commodity currencies AUD and CAD saw smaller gains and NZD remained on its backfoot. EUR traded just above 1.1900 at one point, but receded below 1.1800 to end the week around 1.1785 – a modest gain. The DXY Index ended the week above 93.00 due to Friday’s rally. Despite US-China tension, CNH strengthened. Separately, TRY hit a record low vs. USD. Weakness spread to ZAR.
Ahead – select economic data releases: Sunday, Aug-9: China CPI (Jul) Monday, Aug-10: Japan Current Account (Jun), Australia NAB Business Confidence (Jul) Tuesday, Aug-11:UK Claimant Count (Jul), German ZEW Economic Sentiment (Aug), Canada Housing Starts (Jul), US PPI (Jul), RBNZ Monetary Policy Decision Wednesday, Aug-12: UK GDP (Q2), UK Trade Balance (Jun), Sweden CPI (Jul), US CPI (Jul), Australia Employment (Jul) Thursday, Aug-13:China Fixed Asset Investment (Jul), Industrial Production (Jul) Friday, Aug-14: EU GDP (Q2), US Retail Sales (Jul), US Michigan Consumer Sentiment (Aug).
FX Seasonality Table: August
It is still early in the month, so we feature our Seasonality Table below. It shows the residual from our factor model, by month for each currency pair, with the idea of identifying patterns in country specific, idiosyncratic FX moves, by month. EM tends to be seasonally weak in August (USD/EM tends to go up).

Exante Data: New Releases
We launched a daily cross-asset monitor, which looks at global moves in all major asset classes (>60 instruments in total) and maps them into S&P 500 equivalent space. Founder Jens Nordvig: “The goal is to get a very quick (10 second) way to absorb all the key signals from global assets sensitive to the risk sentiment.”
We introduced a new heatmap: New Job Postings Online by US State y/y%, 28dma. The heatmap will be released weekly. Data provided by our friends at Link Up Job Search.
Jens Nordvig wrote a Twitter thread on what may be the most important chart in global fixed income of 2020. Foreigners are aggressively accelerating their purchases of Chinese bonds, with the pace reaching >$20bn in July alone.
August 6 marked four months since Max Global Lockdown. That was achieved on April 6 when 76% of global cities had traffic congestion down 40% y/y or more. Now, only 13% of cities have congestion down 40%. Check out these side-by-side comparison charts – Top 30 Global Cities with Most Depressed Traffic Congestion April 6 and August 6 data.
Updates to the cross-asset monitor, job postings heatmap, and traffic congestion charts will be published on our Twitter feed.
Media
- Senior Advisor Brad Setser gave key commentary to the Financial Times. The reporting highlights Turkey’s collapse in tourism and its implications for the country’s broader financial health. “I think if Turkey continues on its current path, there will come a time when the government is forced to let the exchange rate depreciate,” Setser said.