

On Optimal Social Distancing – How Long Must We Do This?
This letter draws on research previously published for Exante Data clients. It is meant to reach a broader audience as part of our COVID public service efforts (see link). As such, this letter can be forwarded and quoted.
Social distancing works
Since January, the team at Exante Data has been spending most of its time on forecasting the trajectory of the COVID outbreak, initially in China and then globally. We have learned a lot in the process, and we now have many country-specific data points available.
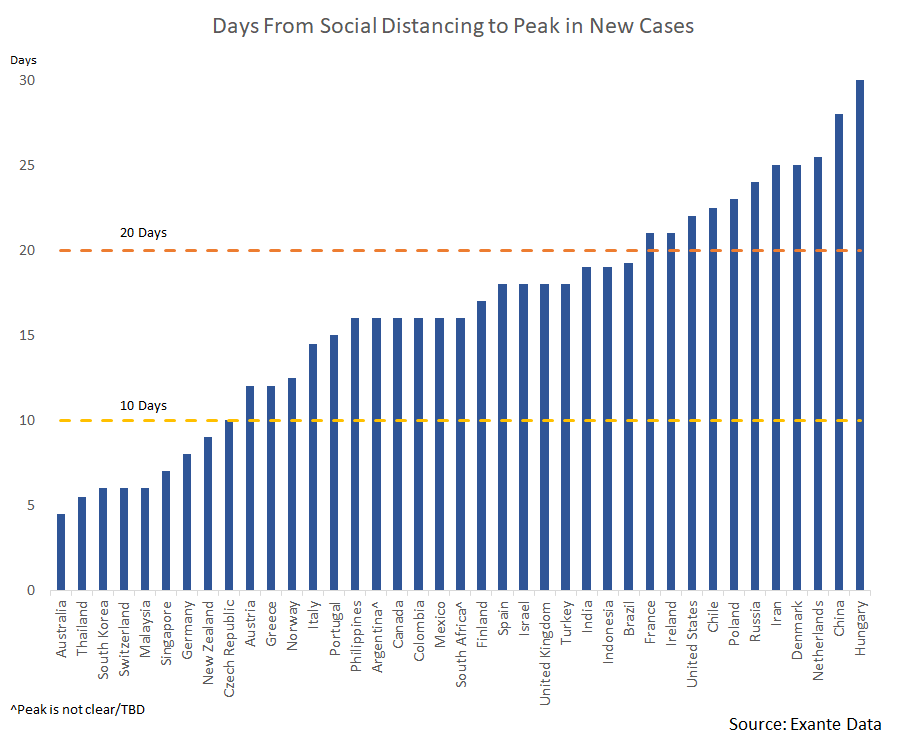
At a high level, there is a remarkably strong and consistent pattern between social distancing efforts and slowing outbreaks. The lags vary slightly by country. But it generally takes 10-20 days from when aggressive social distancing is put in place, to when a peak in new cases has been achieved.

The chart above illustrates this for 40 countries we track very closely. For each country, we measure when social distancing begins and when a peak in new cases is achieved.
– The bar begins when a critical threshold for social distancing measures has been achieved. This is based on a comprehensive list of social distancing parameters we track, including both policy steps (school closings, stay-at-home orders etc.) and metrics of people movement based on alternative data sources (let us know if you are interested in the underlying data for this).
– The bar ends when (a temporary) peak in new cases has occurred. We define this as when we have not reached a new peak for 7 days (we note it is possible we could see a re-acceleration in new cases in a “2nd wave”, as seen in Singapore recently).
The conclusion is that for a long list of countries, we have now seen that aggressive social distancing can contain the outbreak within 2-3 weeks (the median in our sample is 17 days). Some countries, such as Australia, and Korea are faster. Others, including the US, appear to be slower. But the broad conclusion is that social distancing does work.
A caveat to this analysis is that the outbreak may not be accurately captured due to testing short-falls. But we supplement our day-to-day analysis with testing data to obtain confidence that the observed trends in positive cases are not just a function in the magnitude of testing (see trellis in appendix).
How much social distancing is optimal?
Flattening the curve is not a victory in itself, however. There is a dramatic economic cost associated with social distancing, certainly in the extreme form we have observed in most major economies over the past 2-3 months.
Countries that have achieved a slowing of the outbreak will now look to find the right balance between slowing the outbreak and minimizing the economic damage. At this point, many countries have opted for near-maximum social distancing, meaning that we have limited knowledge about how COVID transmits during ‘moderate social distancing’.
We have a data point from China, suggesting that a return to work process is feasible without triggering a fresh uncontrolled outbreak (this has been studied by Imperial College London using Exante Data’s metric of social mobility). But it is an open question as to whether the experience from China can be replicated in western democracies.
Similarly, the impressive ability of Korea to get its outbreak under control may also be hard to replicate globally, given Korea’s unique use of mandatory track and trace technology (which may not be legally feasible in many countries).
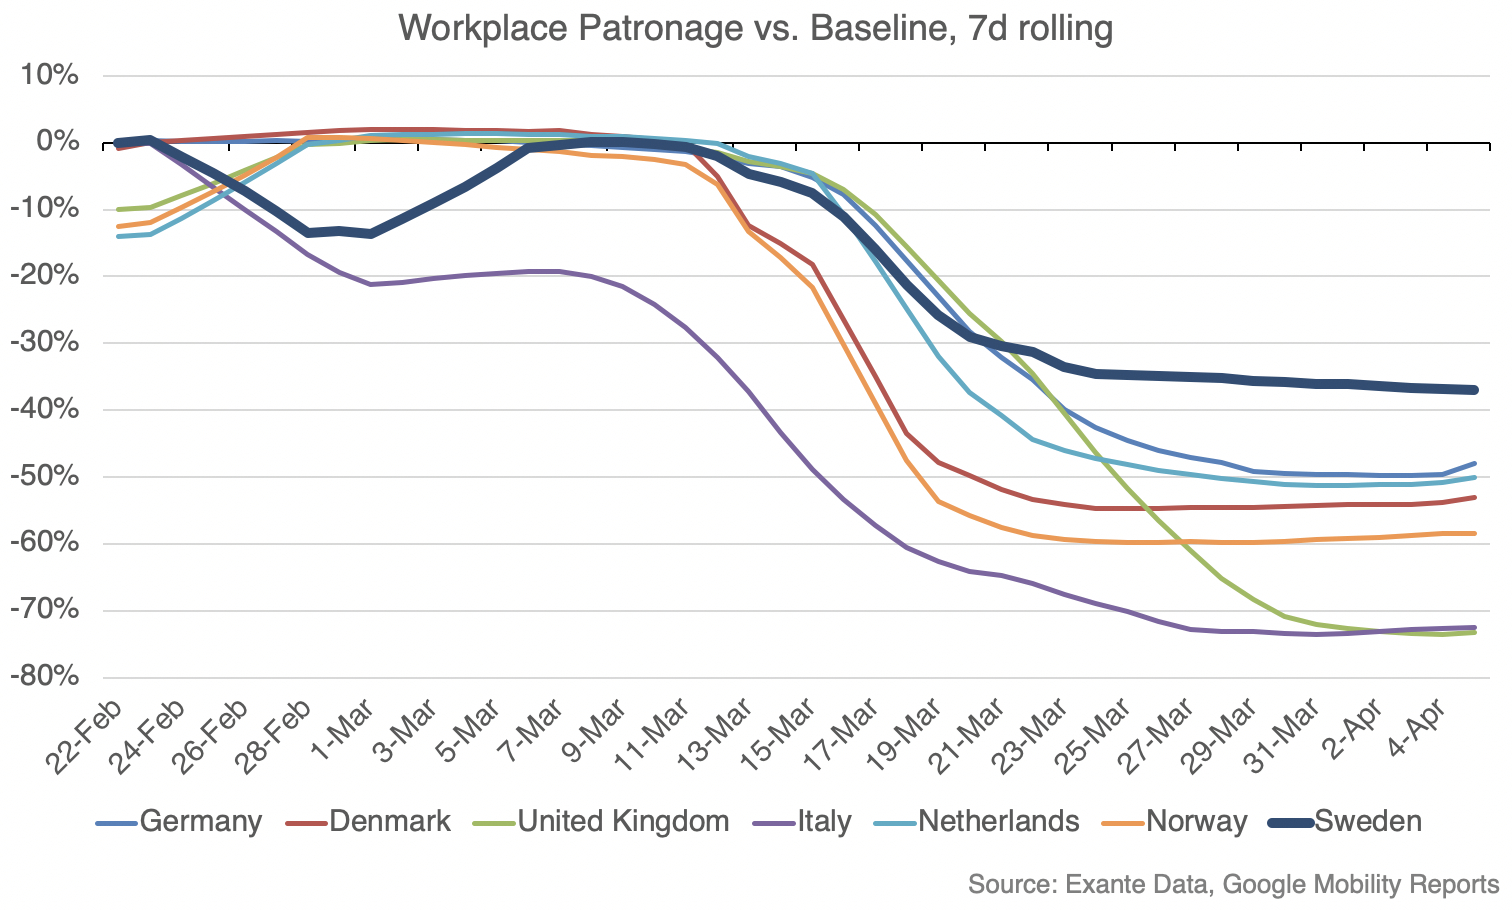
Hence, it is important to think about examples that can be replicated on a broader scale. In Europe, Sweden has adopted a different model. Schools remain open. It is still ok to go to work, if you cannot work from home. You even have some restaurants open (for out-door service).
We can use alternative data to precisely quantify how countries differ in terms of their degree of social distancing. The chart below shows data on the time spent at the workplace (expressed here as deviation from ‘normal’ baseline). Compared to selected European countries, Sweden does stand out in terms of a moderate decline in time spent at workplace. In Sweden, the workplace index created by Google is down just 35%, while it is down 70% in London and Milan, and down around 50-60% in Norway and Denmark, which are often viewed as comparable to Sweden. Importantly, the difference relative to neighboring countries has now been in place for 2-3 weeks, which means that it should have an impact on the outbreak.
There has been some focus on the notion that the death rate (including when scaling for size of population) is higher in Sweden than other countries in Northern Europe. But how the deaths are recorded could play a role here. In terms of the actual growth of new cases. In terms of the growth of new cases, the trend over the last week has been 5% in Sweden versus 1-3% in Denmark and Norway.
We think the most important metric, however, is whether hospitals can cope with the burden. The chart below shows the numbers reported as currently in intensive care (ICU) in Scandinavia. It is clear that the trajectory is different in Sweden compared to Norway and Denmark, where more aggressive social distancing has been adopted. But we do not know yet whether the Swedish hospital system’s capacity will ultimately be exhausted. There has been some flattening of the Swedish curve lately, and if that trend persists, or improves further in coming weeks, it would be a signal that the Swedish model may indeed be sustainable.
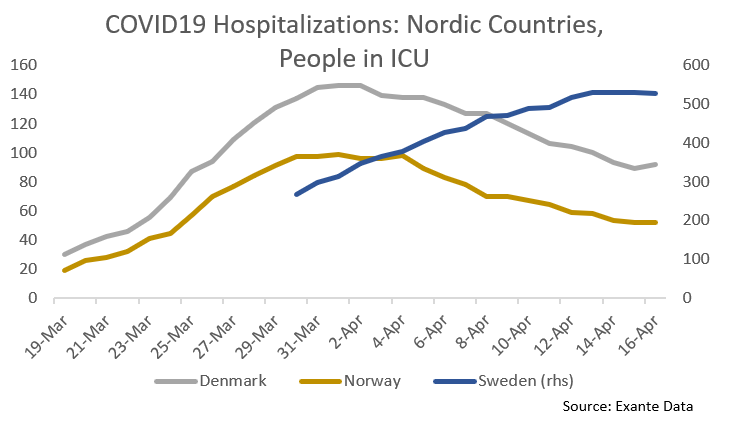
This is an example of why we think hospital data is increasingly crucial to forecast policy responses, and we are spending a lot of effort tracking it.
The outlook
The debate about reopening the economy is heating up as many countries have seen a peak in new cases. Austria and Denmark have taken some baby steps this week, and Germany will allow certain shops to re-open next week.
The most important current question in economics is how much ‘normalization’ is feasible without restarting an uncontrolled outbreak.
Early examples of ‘moderate social distancing’ will be important here. Whether Sweden can keep its outbreak (and pressure on its hospital system) at a manageable level is likely be an important marker for how quickly countries can start to re-open their economies. In the first instance, this will be relevant for European countries taking initial steps in coming weeks. For the US, which is generally 2-3 weeks behind, such examples will be relevant to steps taken towards re-opening during May.
Jens Nordvig
Founder & CEO
Exante Data Inc.
Founder & CEO
Exante Data Inc.
Appendix: New COVID cases and hit-ratios in tests for 30 countries globally
Note we will be auto-tweeting an update on this data daily, as soon as it is available on @ExanteData handle (and note the last data point may be partial).
