

A Primer On Real-Time China Activity Indicators
Since the shock from the coronavirus hit China, we have been tracking real time activity indicators. Our basic philosophy is the following: Given how severe the situation is, and given how lagged traditional macro indicators are, there is now considerable value in tracking alternative indicators.
China’s policy response to the virus has been about restricting people movement, and confidence effect are likely depressing activity too. The most extreme example of this is in Wuhan (the epicenter of the outbreak), which is essentially only allowing movement when absolutely needed.
Overall, we think real-time indicators of people movement can be extremely valuable in tracking ‘China’s return to work’ and serve as a proxy of how depressed economic activity is relative to normal.
The chart below shows our preferred summary chart on people movement within China’s main cities. It is shown as a median, to capture a lot of information in one chart, and to avoid outliers driving the result. It is the chart we are making available daily on the @ExanteData twitter feed.
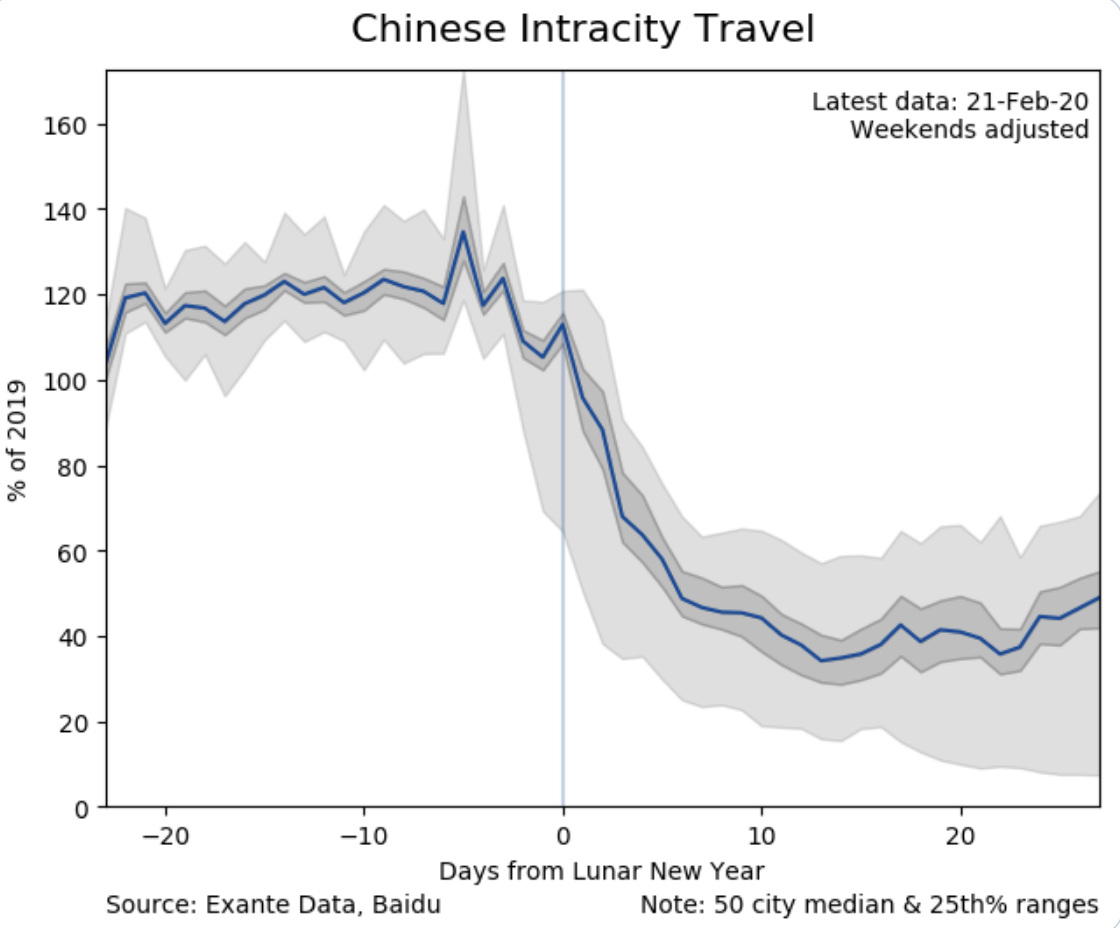
The chart illustrates travel activity within 50 major Chinese cities. The underlying data tracks daily trips per capita. Last year, a typical number of trips per person was five every day. At the moment, we are observing about 2-3 such trips, using Baidu data. To benchmark the data, we compare with a similar point in 2019, following the Lunar New Year. The blue line is the median across cities. The dark grey area is defined by the 25% percentiles. The entire light grey area are defined by the most extreme cities, with Wuhan defining the bottom, with activity tracking around 10% of normal, at this time of year. For the median city, intra-city travel activity is currently running at around 50% of normal.
As background, this metric varies considerably by city, as illustrated in the trellis below. Wuhan is the most depressed, while Qingdao has bounced back substantially.

Source: Baidu and Exante Data.
There are many different ways we can slice the data on travel movement in China. Another metric we have been monitoring is the travel activity in and out of major cities. This is particularly helpful in capturing the return of migrant workers, which may be linked to manufacturing production.
The below chart shows inbound and outbound travel for the important manufacturing hub Shenzhen. It shows an spike in inbound travel in early February travel when a number of important manufacturing sites re-opened. But after that spike, the level of activity has remained quite depressed, as the return to work process remains very gradual and cautious.

Source: Baidu and Exante Data
We have cross-checked these indicators with data from the Ministry of Transport, alternative data from Tencent and Tom Tom, as well as anecdotal evidence of the pace of return of migrant workers. All told, we think the message is very consistent across the various types of indicators, and consistent with very depressed activity and a very slow process of return to work.
We will leave it at that for now. But we will continue to track this issue, literally day and night over the coming days, weeks and months. Let us know if you have questions on info@exantedata.com
Souce: Baidu